Characterization of precipitation through on climate extreme indicators at the Casablanca meteorological station, 1980-2018
Article Sidebar
Main Article Content
Abstract
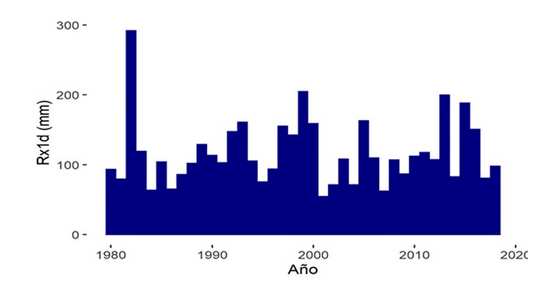
The study of rainfall patterns and extreme events is fundamental to understanding climate variability and mitigating its impacts on society and the economy, particularly in vulnerable regions such as the Caribbean. The objective of this work was to characterize rainfall patterns based on climate extreme indicators at the Casablanca meteorological station during the period 1980-2018. Daily 24-hour rainfall series, obtained from the database of the Cuban Institute of Meteorology, were used. The methodology included rigorous quality control with a threshold of three standard deviations, a homogeneity test using the RHtest, and the calculation of eight ETCCDI indicators (Rx1d, Rx5d, R10, R20, R100, R95p, R99p, and PRCPTOT) using the RClimdex software. The main results showed that the maximum precipitation in a single day (Rx1d) increased slightly (0.28 mm/decade), as did the precipitation associated with the 99th percentile (R99p, 10.39 mm/decade). In contrast, the maximum over five consecutive days (Rx5d) decreased (-6.04 mm/decade), as did the number of days with rainfall ≥10 mm (R10, -0.34 days/decade) and ≥20 mm (R20, -0.52 days/decade), the precipitation at the 95th percentile (R95p, -4.53 mm/decade), and the total annual precipitation (PRCPTOT, -9.08 mm/decade). It was concluded that, although mixed trends were observed (increases in some extreme indicators and decreases in others), none of the changes were statistically significant, demonstrating high natural variability without clear modifications in rainfall extremes during the analyzed period.
Downloads
Article Details

This work is licensed under a Creative Commons Attribution-NonCommercial 4.0 International License.
Those authors who have publications with this journal accept the following terms of the License Attribution-NonCommercial 4.0 International (CC BY-NC 4.0):
You are free to:
- Share — copy and redistribute the material in any medium or format
- Adapt — remix, transform, and build upon the material
The licensor cannot revoke these freedoms as long as you follow the license terms.
Under the following terms:
- Attribution — You must give appropriate credit, provide a link to the license, and indicate if changes were made. You may do so in any reasonable manner, but not in any way that suggests the licensor endorses you or your use.
- NonCommercial — You may not use the material for commercial purposes.
- No additional restrictions — You may not apply legal terms or technological measures that legally restrict others from doing anything the license permits.
The journal is not responsible for the opinions and concepts expressed in the works, they are the sole responsibility of the authors. The Editor, with the assistance of the Editorial Committee, reserves the right to suggest or request advisable or necessary modifications. They are accepted to publish original scientific papers, research results of interest that have not been published or sent to another journal for the same purpose.
The mention of trademarks of equipment, instruments or specific materials is for identification purposes, and there is no promotional commitment in relation to them, neither by the authors nor by the publisher.
References
Almarza, C. (2004). Olas de calor en España. Ambienta: La revista del Ministerio de Medio Ambiente(35), 58-59.
Armenta, G. (2016). Análisis de tendencia climáticas y eventos climáticos extremos para Ecuador. Tercera Comunicación Nacional de Cambio Climático del Ecuador, Quito, Euador.
Ávila, K., & Martín. J. (2013). Análisis estadístico de los eventos extremos de precipitación en la zona centro y sur de Chile continental. Cuadernos Geográficos (52), 69-83.
Burgos, Y., & González, I. (2012). Análisis de indicadores de extremos climáticos en la Isla de Cuba. Revista de Climatología, 12, 81-91.
Centella, A., Rubiera, J., & Pérez, R. (1996). Elementos de Meteorología y Climatología. Suplemento especial.
Díaz, C., & Batanero, C. (2006). ¿Cómo puede el Método Bayesiano contribuir a la investigación en Psicología y Educación? . Paradigma, 35-54.
ETCCDI . (2016). Climate and Ocean- Variability. Predictability. and Change. (Expert Team on Climate Change Detection and Indeces). Recuperado el 5 de Junio de 2020, de http://www.clivar.org/clivarpanels/etccdi/indices-data/indices-data
González, I., Barcia, S., & Hernández, D. (2017). Comportamiento de indicadores de extremos climáticos en la Isla de Juventud. Revista Cubana de Meteorología, 23 (2), 217-225.
Griffiths, G., Salinger, M., & Leleu, I. (2003). Trends in extreme daily rainfall across the South Pacific and relationship to the South Pacific Convergence Zone. International Journal of Climatology, 23 (8), 145-149.
Hernández, A., Guenni, L., & Sansó, B. (2011). Características de la precipitación extrema en algunas localidades de Venezuela. Interciencia, 36 (3), 185-191.
IPCC. (2018). Contribuión de los Grupos de Trabajo I. II y III al Quinto Informe de Evaluación del Grupo Intergubernamental de Expertos sobre el Cambio Climático. Informe en Síntesis. Ginebra. Suiza.
Klein, A., & Können, G. (2003). Trends in Indices of Daily Temperature and Precipitation Extremes in Europe. 1946-1999. International Journal of Climate, 16 (22), 3665-3680.
Marín, J. (2017). Dínamica de los eventos hidroclimáticos extremos en la cuenca del río Chinchiná por efecto de la variabilidad climática. Tesis de Maestría. 141. Manizales. Colombia: Universisdad Nacional de Colombia.
Martínez, M., Sánchez, J., & Ojeda, W. (2007). Determinación de períodos de sequía y lluvia intensa en diferentes regiones de México ante escenarios de Cambio Climático. México.
OMM. (2016). Estado del Clima mundial en 2011-2015. Organización Meteorológica Mundial. Ginebra. Suiza.
OMM. (2017). Declaración sobre el del clima mundial en 2016. Organización Meteorológica Mundial. Ginebra. Suiza.
OMM. (2019). Declaración sobre l estado del Clima munial en 2018. Organización Meteorológica Mundial. Ginebra. Suiza.
OMM. (2020). Declaración sobre el estado del clima mundial en 2019. Organización Meteorológica Mundial. Ginebra. Suiza.
Peterson, T., Taylor, M. A., Demeritte, R., Duncombe, D., Burton, S., Thompson, E., y Gleason, B. (2002). Recent Changes in Climate Extremes in the Caribbean Region. Journal of Geophysical Research: Atmospheres, 107.
Petisco de Lara, S., Ramos, P., & Martín, J. (2012). Extremos de temperatura y precipitación para el siglo XXI en España. Área de Evaluación y Modelización del Clima, 198-205.
Pinskwar, I., Graczyk, D., & Kundzewicz, Z. (2017). The heat goes on-changes in ndeces of hot extremes in Poland. Theoretical and Applied Climatology, 129, 459-471.
Roura, P. (2014). Análisis de modelos probabilístios para caracterizar la lluvia total máxima en 24 horas . Tesis de Maestría. INSMET. La Habana. Cuba.
Schönwiese, C., & Trömel, S. (2003). Secular change of extreme monthly precipitation in Europe. Theorical and Applied Climatology, 75, 245-250.
Stephenson, T. S., Vincent, L. A., Allen, T., Van Meerbeeck, C., McLean, N., Peterson, T. C., & Trotman, A. R. (2014). Changes in extreme temperature and precipitation in the Caribbean region. 1961-2010. International Journal of Climatology, 34(9).
Villacis, E., & Marrero, N. (2017). Precipitaciones extremas en la ciudad de Quito. provincia Pinchincha-Ecuador. Ingeniería Hidráulica y Ambiental, 38 (2), 102-113.
Zhang, X., & Yang, F. (2004). RClimDex (1.0). Manual de usuario. Ontario, Canadá.